
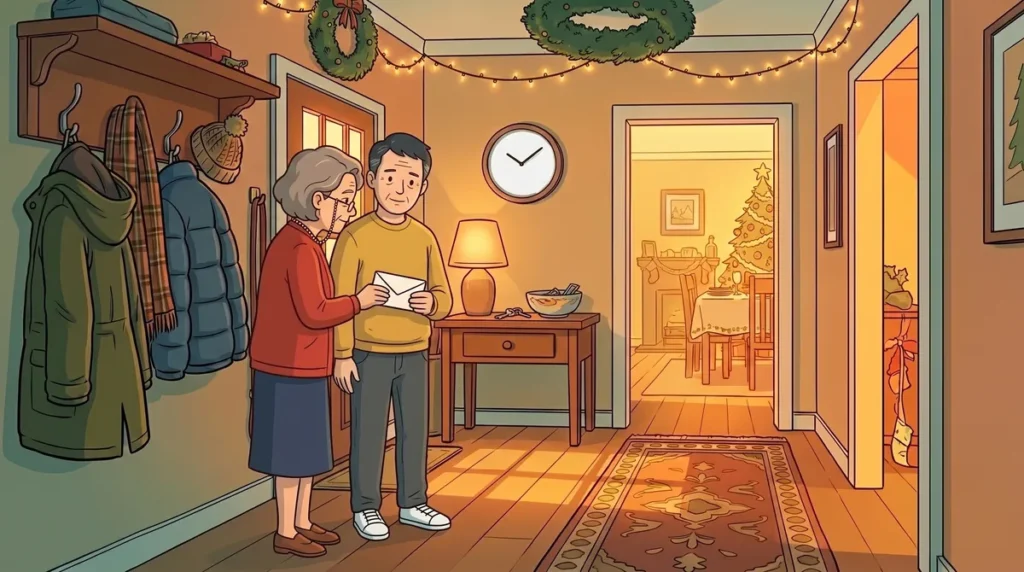
Parents giving money to adult children is the norm in the US, and more than a third of those who do it say it hurt their own finances at least somewhat. In a Pew survey, 59 percent of parents of 18 to 34-year-olds gave help in the past year, and 36 percent of that group said it cost them1.

How many parents give money to adult children?
Most do. Pew Research Center asked US parents who had a child aged 18 to 34, and 59 percent said they had given some financial help in the past year1. That is a survey of what parents say, so it tells us how common the habit is, not how large the amounts are.
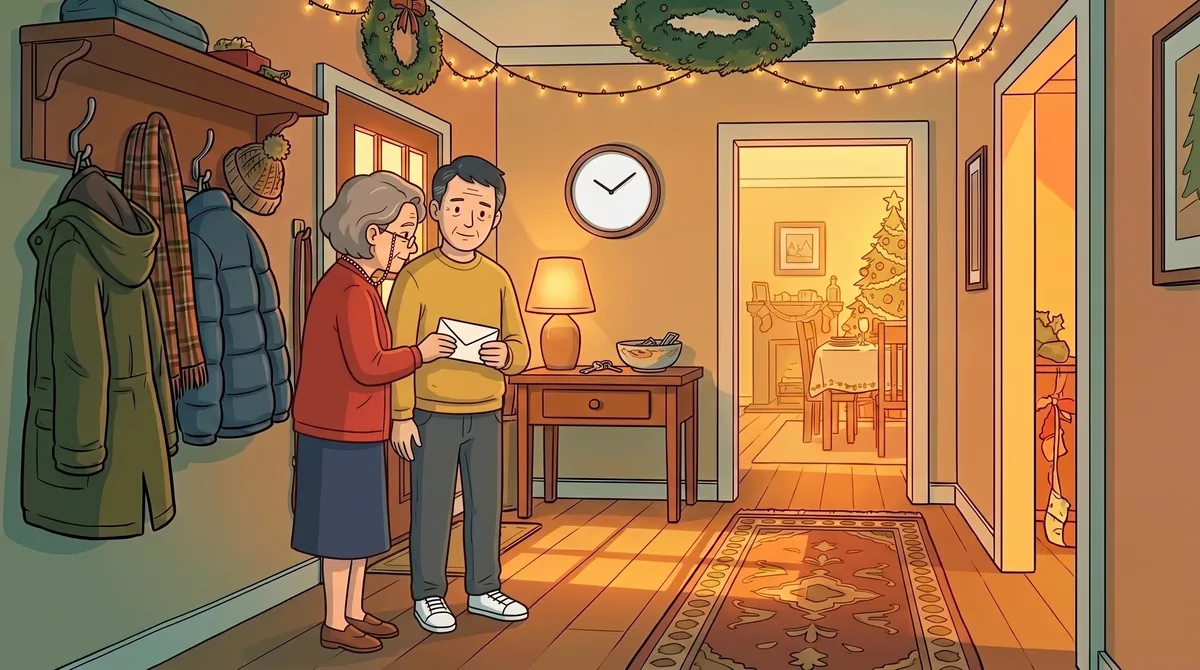
In the video’s hypothetical story, the help is small and regular: a folded envelope of cash every Christmas. The story is made up, but the direction of the money is the ordinary one. Parents giving to children is the norm the survey describes, which is what makes the story’s reversal worth noticing1.
Does it hurt the parents’ own finances?
For a sizeable minority, yes. Of the parents who gave help, 36 percent said doing so hurt their own financial situation at least somewhat1. That leaves 64 percent who said it did not hurt much or at all1.
The share depends heavily on income. Among lower-income parents who helped, 49 percent said it hurt, against 37 percent in the middle and 22 percent in the upper bracket1. A gift that costs a wealthy parent little can come out of a groceries budget for another.
36%
of US parents who helped an adult child say it hurt their own finances at least somewhat1
Self-reported, from a Pew survey of parents of 18 to 34-year-olds. It says how many feel the cost, not how much it was, and it says nothing about why parents keep giving.
Is gift money spent differently from earned money?
Often, yes, though the evidence is about small amounts. In a study of one online grocer, 34,410 orders from 2,889 customers in 2005, shoppers who redeemed a $10-off coupon spent about $1.59 more on that order, and the extra went on items they did not usually buy2. The money did not just stretch the basket. It changed what went in it.
The authors read that as mental accounting, the habit of putting money into separate mental accounts depending on where it came from2. A small windfall seems to land in a pocket of its own and get spent more freely than ordinary income.
It does not follow that gifts get wasted. The authors point out that the customers were not randomly assigned, and the effect is a small one on one grocer’s orders2. A separate older study found that people given money they had not expected spent or gambled more of it than people told in advance, but only an abstract was read, with students as the sample3.
In the hypothetical story, the character does the opposite of what these studies describe: the envelopes go unopened. That is the story’s choice. Nothing here shows what people do with cash from a parent in particular.
Why do people avoid looking at money that worries them?
One well-measured version is how often people check their own retirement accounts. Researchers following 100,000 randomly selected paperless accounts out of more than a million Vanguard investors in 2007 and 2008 found that logins fell by about 9.5 percent after the market declined4. People looked less when looking was most likely to hurt.
The same pattern shows up in other places. Studies of Scandinavian investors, bank customers and pension savers found they looked up their balances on days when they knew the market had risen and held back on days it had fallen5. Looking never changed the number. It only changed how the day felt.
These results are about people’s own accounts, not about parents hiding trouble from children, and no study read here measures the second. The mechanism is still a useful one to know. If checking feels bad, an unwelcome number can sit unopened for a long time. There is a longer look at it in why some people avoid checking their bank balance.
What can care for an older parent cost?
When a parent needs help at home, the bill can be larger than any family gift. In a 2024 survey of more than 15,000 care providers across 431 US regions, the national median cost was $77,792 a year for a home health aide, $70,800 for assisted living and $127,750 for a private room in a nursing home6.
Those are medians in 2024 dollars from an insurer’s survey, so they show scale rather than any one family’s bill, and costs differ a great deal by region6. They help explain why the hypothetical story’s crisis is expensive, and why parents’ savings can look fine until they are needed.

What does the video’s hypothetical story assume?
The video is a made-up life. Every figure in it is computed from the assumptions below, which draw on real data and are not predictions.
- Starting pay of $60,000 a year at 27, rising to $75,000 at 35, from median US full-time earnings by age7.
- Rent of $1,500 a month, the US median gross rent8. A brother with a truck payment of $720 a month, the average new-car loan payment9.
- A starting invested balance and a fixed monthly contribution, which are the story’s own choices rather than data; the exact figures are in the video’s description.
- A market fall at 32 taking the balance from about $110,000 to $71,000, in line with the worst calendar year in a long record10.
- A year of care for a parent at 38 costing $78,000, the national median for a home health aide6.
- A return of 6.8 percent a year after inflation, a long-run historical average, not a forecast11.
The characters are fictional. These are assumptions, not predictions, and the outcome is not typical.
What the research doesn’t show
It doesn’t show why parents give. The Pew figures are what parents report about cost, not a measure of their reasons or of the amounts1.
It doesn’t show that parents hide money trouble from children. Claims like that circulate, but none could be checked at the source here, so none is made.
It doesn’t show how people treat cash from a parent. The grocery study is one grocer in one year of orders, and the surprise-money study is a student sample read from its abstract23.
The account-checking findings cover people’s own investments, mostly in 2007 and 2008, and the Scandinavian study was read from its abstract with no figures used45. The care costs are an insurer’s medians6.
Nothing here says whether, or how much, anyone should give or accept.
So what is the cost of quietly helping?
On the evidence, helping adult children is common, and for more than a third of parents who do it, it costs something real1. The money moves easily. The conversation about it is the part the research has little to say about, and it is the part the video’s story turns on: the cost it counts is not the amount, it is what stays unsaid.
Sources
- Pew Research Center (2024, January 25). Financial help and independence in young adulthood. https://www.pewresearch.org/social-trends/2024/01/25/financial-help-and-independence-in-young-adulthood/
- Milkman, K. L., & Beshears, J. (2009). Mental accounting and small windfalls: Evidence from an online grocer. Journal of Economic Behavior & Organization, 71(2), 384-394. https://faculty.wharton.upenn.edu/wp-content/uploads/2012/04/Mental-accounting.pdf
- Arkes, H. R., Joyner, C. A., Pezzo, M. V., Nash, J. G., Siegel-Jacobs, K., & Stone, E. (1994). The psychology of windfall gains. Organizational Behavior and Human Decision Processes, 59(3), 331-347. https://ideas.repec.org/a/eee/jobhdp/v59y1994i3p331-347.html
- Sicherman, N., Loewenstein, G., Seppi, D. J., & Utkus, S. P. (2016). Financial Attention. The Review of Financial Studies, 29(4), 863-897. https://doi.org/10.1093/rfs/hhv073
- Karlsson, N., Loewenstein, G., & Seppi, D. (2009). The ostrich effect: Selective attention to information. Journal of Risk and Uncertainty, 38(2), 95-115. https://doi.org/10.1007/s11166-009-9060-6
- Genworth and CareScout (2025, March 4). Cost of Care Survey 2024: more than 15,000 surveys of long-term care providers across 431 regions, July-December 2024. https://insurancenewsnet.com/oarticle/genworth-and-carescout-release-cost-of-care-survey-results-for-2024
- U.S. Bureau of Labor Statistics (2026, Q2). Usual Weekly Earnings of Wage and Salary Workers, table 3: Median usual weekly earnings of full-time wage and salary workers by age, race, Hispanic or Latino ethnicity, and sex. https://www.bls.gov/news.release/wkyeng.t03.htm
- U.S. Census Bureau (2025, September 11). American Community Survey 2024 1-year estimates, press release ‘The Cost of Homeownership Continues to Rise’; table B25064. https://www.census.gov/newsroom/press-releases/2025/acs-1-year-estimates.html
- Experian (2026, August 27). State of the Automotive Finance Market, Q2 2026: ‘From Hybrids to Refinancing: Consumers are Finding New Roads to Vehicle Affordability’. https://www.experian.com/blogs/insights/tag/state-of-the-automotive-finance-market/
- Damodaran, A. (updated January 2026). Historical Returns on Stocks, Bonds and Bills: 1928-2025. NYU Stern. https://pages.stern.nyu.edu/~adamodar/New_Home_Page/datafile/histretSP.html
- FACT-09 (Damodaran, histretSP, nominal 10.0%) combined with Federal Reserve Bank of Minneapolis, Consumer Price Index, 1913- (BLS CPI-U annual averages). https://www.minneapolisfed.org/about-us/monetary-policy/inflation-calculator/consumer-price-index-1913-
Written by Wallet Wired from the same research as the video. Drafted with AI assistance; every figure is checked against the sources listed above.
Educational content, not financial advice.