
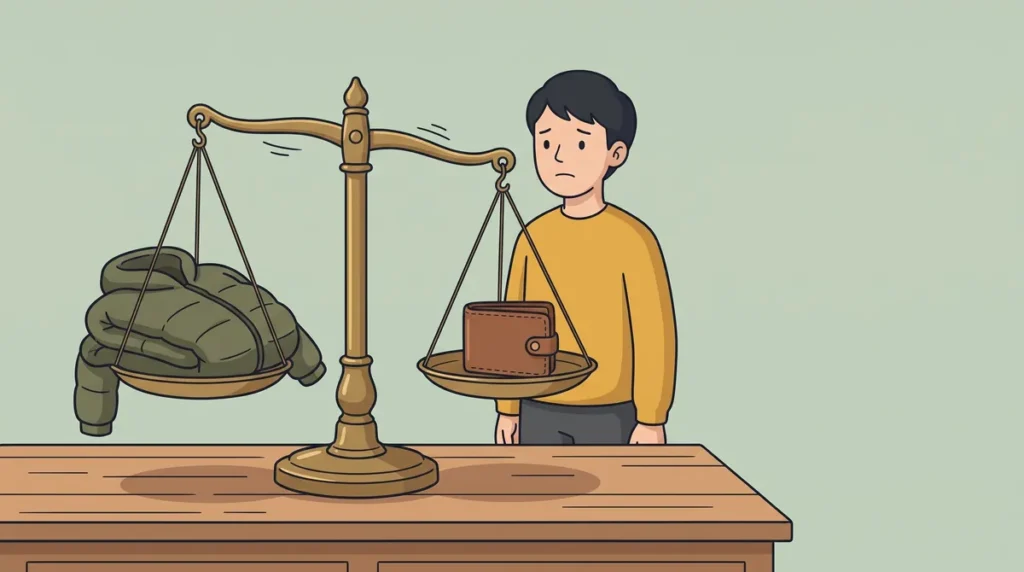
Why can’t I spend money even when I can afford it? For some people paying itself produces a felt distress, and how strongly differs a lot from person to person. In a survey of 13,327 people1, the feeling barely tracked income2, it wasn’t the same as being frugal3, and for many it peaked before the money moved4.
Why can’t some people spend money even when they can afford it?
Picture a coat on a rail, a card in a wallet, and a hand that won’t take the card out. The researchers Scott Rick, Cynthia Cryder and George Loewenstein, then at Carnegie Mellon, suspected that the hesitation was less about the bank balance than about how it feels to hand money over1. They pulled four questions out of a longer money questionnaire and showed that the answers hang together as a single measure of how much paying hurts1.
The result is called the tightwad–spendthrift scale, and it is a measure of what researchers call the pain of paying. Scores ran along a spectrum, and the two ends got names. Of 13,327 respondents, 3,248 (about 24%) landed at the tightwad end, where paying hurts most, and 2,046 (about 15%) at the spendthrift end, where it barely registers; the rest, about 60%, sat between the two1.
Tightwads outnumbered spendthrifts by about three to two, and the authors themselves found that surprising given how little Americans save1. The scale also held steady: the same people scored almost the same when they were asked again about 78 days later5.
That split describes the people who answered, not the public. Most of the sample came through a newspaper science column, and the authors note that it may not be representative1.
Are people who struggle to spend just poorer?
They are not, on this evidence. Across five self-reported income bands, tightwads and spendthrifts turned up in almost the same proportions, with only two small gaps: spendthrifts were about 4% likelier in one lower band, and tightwads about 5% likelier in one upper-middle band2. The top band started at $250,000, and the study says nothing about people far above that2.
The two groups still look different from the outside. Among people who use credit cards, 60% of spendthrifts said they carried a balance, against 20% of tightwads6. Tightwads were also more than twice as likely to report over $250,000 saved, and spendthrifts more than twice as likely to report under $10,0006. Those figures are what people said about themselves, and they show an association, not a cause6. They do explain why the tightwad tends to be seen as the responsible one.
Is a tightwad the same as someone who is frugal?
Related, but not the same. The scale correlates at .46 with a separate frugality scale, its closest neighbour among the measures it was compared with3. That is a real overlap, and far from a match.
The authors’ reading is that the two differ in the feeling behind them: a frugal person gets a small pleasure from saving, while a tightwad is hurting at the moment of paying3. From outside, walking away without the coat looks like the same choice for both. One person leaves pleased that the money is kept; the other leaves having escaped a feeling. That split is the researchers’ interpretation of follow-up analyses, and it is not a directly measured fact3.
83 of 138
Tightwads who said paying hurt most before the purchase4
One self-report question put to 652 people in Pittsburgh. Spendthrifts leaned the other way: 56 of 114 said it hurt most afterwards.
When does paying hurt most: before or after you buy?
For tightwads, before. In the same research group’s Pittsburgh sample, respondents were asked when spending hurts most: minutes before buying, at the moment of buying, or minutes after4. Most tightwads said before (83 of 138, against 32 of 138 for after), while spendthrifts were likelier to say after, with the statement (56 of 114 after, 36 of 114 before)4. The purchase and the price are identical, yet the feeling arrives at a different time.
A brain-scanning study suggests the “no” can form quickly. Brian Knutson at Stanford, with Rick, Prelec and Loewenstein, gave 26 volunteers $20 in cash and scanned them while they saw a product, then its price, then chose7. Each person saw 80 products, and about 30% were bought on average7. Only one random trial per session was made real, so any single choice might be the one that cost them7.
When the price appeared, activity in the insula, a region linked to distress among other things, predicted the choice seconds ahead. It pointed to not buying, beyond how much people said they liked the item7.
One more result comes from an online survey of 538 people8. Offered a $5 overnight shipping fee on a DVD box set, 8% of tightwads and 39% of spendthrifts said yes8. When the same fee was described as a “small $5 fee”, 28% of tightwads said yes, while spendthrifts barely moved at 37%8. The finding is hypothetical, from one survey, and a later test did not agree on every point8.
Where does the pain of paying come from?
Nobody knows yet. There is a hint that it shows up early. Scott Rick and colleagues gave 225 children aged five to ten a real dollar and a choice at a children’s museum, to keep it or spend it on a toy9. About half (51%) spent it, and the children who had said that spending feels bad were less likely to9.
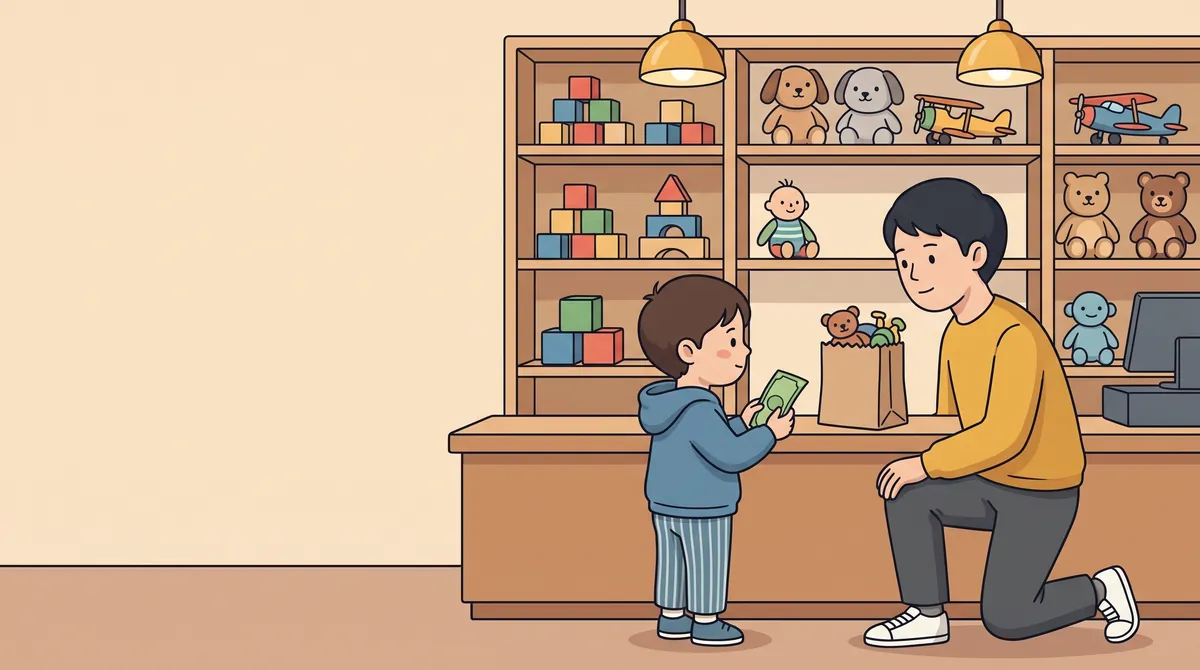
The effect was small, from a museum sample of mostly higher-income families, and it was measured at one point in time9. It does not show that the trait is inborn; the authors say that stability and parental influence are still to be studied9.
In adults it looks stable, at least over a year. People who answered again more than 360 days later scored much the same, with a correlation of .725. Neither childhood poverty nor being born that way is supported by these papers10. Older respondents in one sample were more often tightwads, but that compares different people and doesn’t show anyone changing over time10.
It is not a comfortable position at either end. Both tightwads and spendthrifts say they are unhappy with how they handle spending and wish they could change, and people in the middle are the least unhappy11.
What the research doesn’t show
It doesn’t show that the split describes the public. The 13,327 respondents were mostly newspaper readers who chose to take a survey, most with graduate study, so the 3-to-2 finding describes them1.
It doesn’t show that paying feels like literal physical pain. The brain-scan study found distress-linked activity that predicted not buying, in 26 people in general, and it did not link the questionnaire to the brain7.
It doesn’t show that the trait leads to particular spending or saving. The debt and savings figures are self-reported associations6.
It doesn’t show whether the trait can be changed, or whether spending more would help a tightwad. That is an open question, and the distress might simply move from the till to the statement11. It also doesn’t say where the feeling comes from10.
Nothing here is a recommendation to spend more, spend less, save or invest.
So what does the feeling mean?
For a large share of the people who have been measured, paying arrives as a feeling, and it arrives early, at the rail and at the till, before any money has gone anywhere. It doesn’t follow income2, and it isn’t quite frugality either3. A hesitant hand at the till is not a verdict on character or on a bank balance. It is a measured difference in how paying feels, and what to make of it is still open.
The next question is what “enough” means, and how it moves as people climb; that is covered in what the research says about how much money is enough. A related piece looks at how financial stress affects thinking.
Sources
- Rick, S. I., Cryder, C. E., & Loewenstein, G. (2008). Tightwads and Spendthrifts. Journal of Consumer Research, 34(6), 767-782. https://academic.oup.com/jcr/article-abstract/34/6/767/1845388
- Rick, S. I., Cryder, C. E., & Loewenstein, G. (2008). Tightwads and Spendthrifts. Journal of Consumer Research, 34(6), 767-782. https://academic.oup.com/jcr/article-abstract/34/6/767/1845388
- Rick, S. I., Cryder, C. E., & Loewenstein, G. (2008). Tightwads and Spendthrifts. Journal of Consumer Research, 34(6), 767-782. https://academic.oup.com/jcr/article-abstract/34/6/767/1845388 ; also Rick, S. (2018). Tightwads and spendthrifts: An interdisciplinary review. Financial Planning Review, 1, e1010. https://doi.org/10.1002/cfp2.1010
- Rick, S. I., Cryder, C. E., & Loewenstein, G. (2008). Tightwads and Spendthrifts. Journal of Consumer Research, 34(6), 767-782. https://academic.oup.com/jcr/article-abstract/34/6/767/1845388
- Rick, S. I., Cryder, C. E., & Loewenstein, G. (2008). Tightwads and Spendthrifts. Journal of Consumer Research, 34(6), 767-782. https://academic.oup.com/jcr/article-abstract/34/6/767/1845388
- Rick, S. I., Cryder, C. E., & Loewenstein, G. (2008). Tightwads and Spendthrifts. Journal of Consumer Research, 34(6), 767-782. https://academic.oup.com/jcr/article-abstract/34/6/767/1845388
- Knutson, B., Rick, S., Wimmer, G. E., Prelec, D., & Loewenstein, G. (2007). Neural predictors of purchases. Neuron, 53(1), 147-156. https://doi.org/10.1016/j.neuron.2006.11.010
- Rick, S. I., Cryder, C. E., & Loewenstein, G. (2008). Tightwads and Spendthrifts. Journal of Consumer Research, 34(6), 767-782. https://academic.oup.com/jcr/article-abstract/34/6/767/1845388
- Smith, C., Echelbarger, M., Gelman, S., & Rick, S. (2018). Spendthrifts and tightwads in childhood: Feelings about spending predict children’s financial decision making. Journal of Behavioral Decision Making, 31(3), 446-460. https://doi.org/10.1002/bdm.2071 (read via PMC6178823)
- Rick, S. I., Cryder, C. E., & Loewenstein, G. (2008). Tightwads and Spendthrifts. Journal of Consumer Research, 34(6), 767-782. https://academic.oup.com/jcr/article-abstract/34/6/767/1845388 ; Rick, S. (2018). Tightwads and spendthrifts: An interdisciplinary review. Financial Planning Review, 1, e1010. https://doi.org/10.1002/cfp2.1010
- Rick, S. (2018). Tightwads and spendthrifts: An interdisciplinary review. Financial Planning Review, 1, e1010. https://doi.org/10.1002/cfp2.1010 (reports Rick, Small & Finkel 2011; the primary was not read for this claim)
Written by Wallet Wired from the same research as the video. Drafted with AI assistance; every figure is checked against the sources listed above.
Educational content, not financial advice.